
Zenith
A comprehensive data orchestration and analytical monitoring platform for cloud-native infrastructure.
Engineering remarkable digital performance metrics.
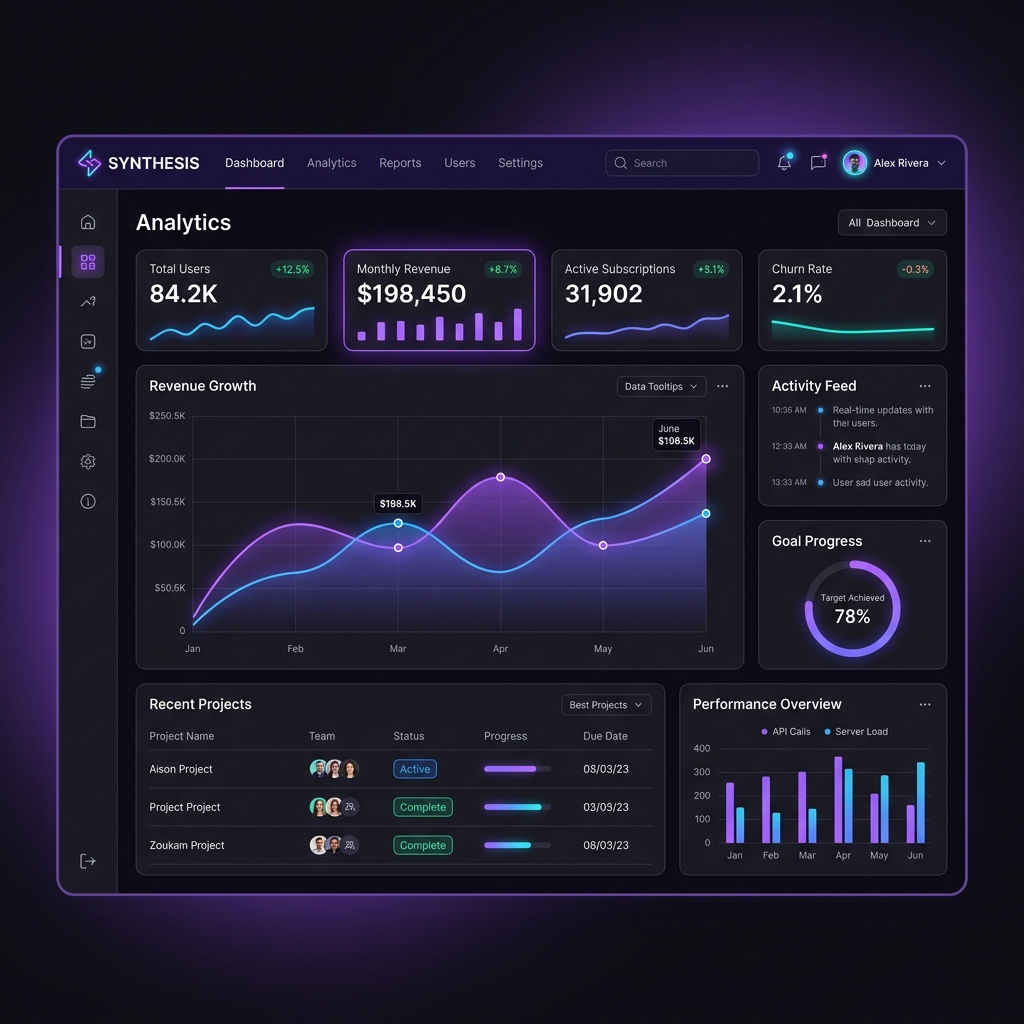
Zenith Analytics centralizes distributed cloud logs, database performance metrics, and application tracing. We designed a dashboard system that supports customizable widget grids, multi-dimensional querying, and dark mode optimizations to reduce cognitive load during incident response.
The Challenge
DevOps and SRE teams are inundated with telemetry. Designing a UI that highlights system outages instantly, without triggering alert fatigue, requires a careful balance of visual hierarchy, density, and interactive diagnostics.
Our Solution
We introduced a dashboard template system with heatmaps, high-density line charts, and context-dependent sidebar logs. An AI-assisted natural language query box is embedded right at the top for instant root-cause search.
Design & technical highlights.
Dynamic Grid Layout
Draggable, resizable analytics cards with instant configuration settings.
Telemetry Inspector
Inspect log files side-by-side with performance spikes, linked automatically.
"Zenith has made our operations dashboard ten times cleaner. Our team responds to incidents significantly faster."
Sarah Jenkins
Director of Infrastructure, Zenith Analytics